Open the Reports page
Click Reports in the left sidebar.
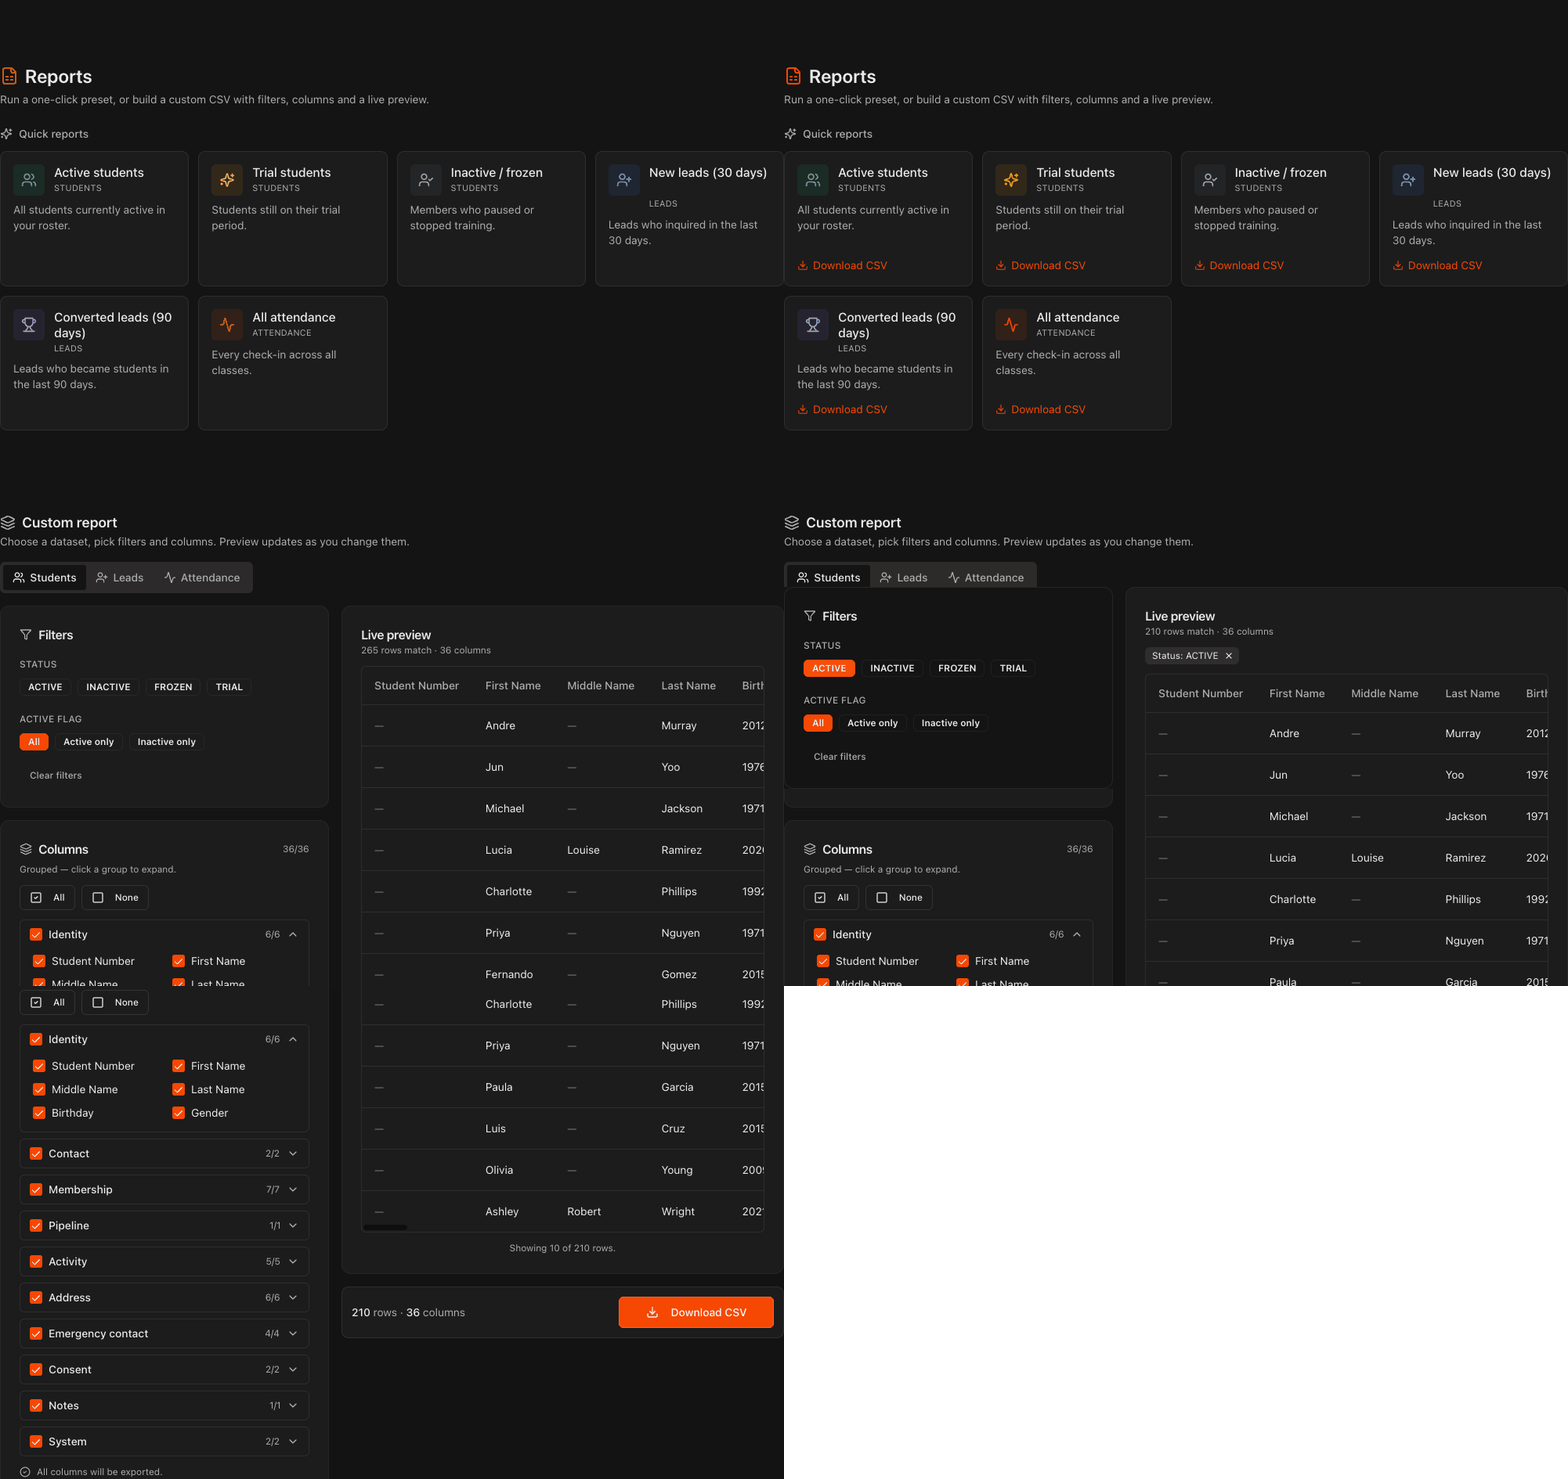
The Reports page gives you two tools: one-click Quick reports presets, and a Custom report builder below them.
Note
With more than one gym, reports follow the gym selector in the header: **All Gyms** combines every gym, or pick one gym. The Students dataset includes a **Home Gym** column.
Download a Quick report
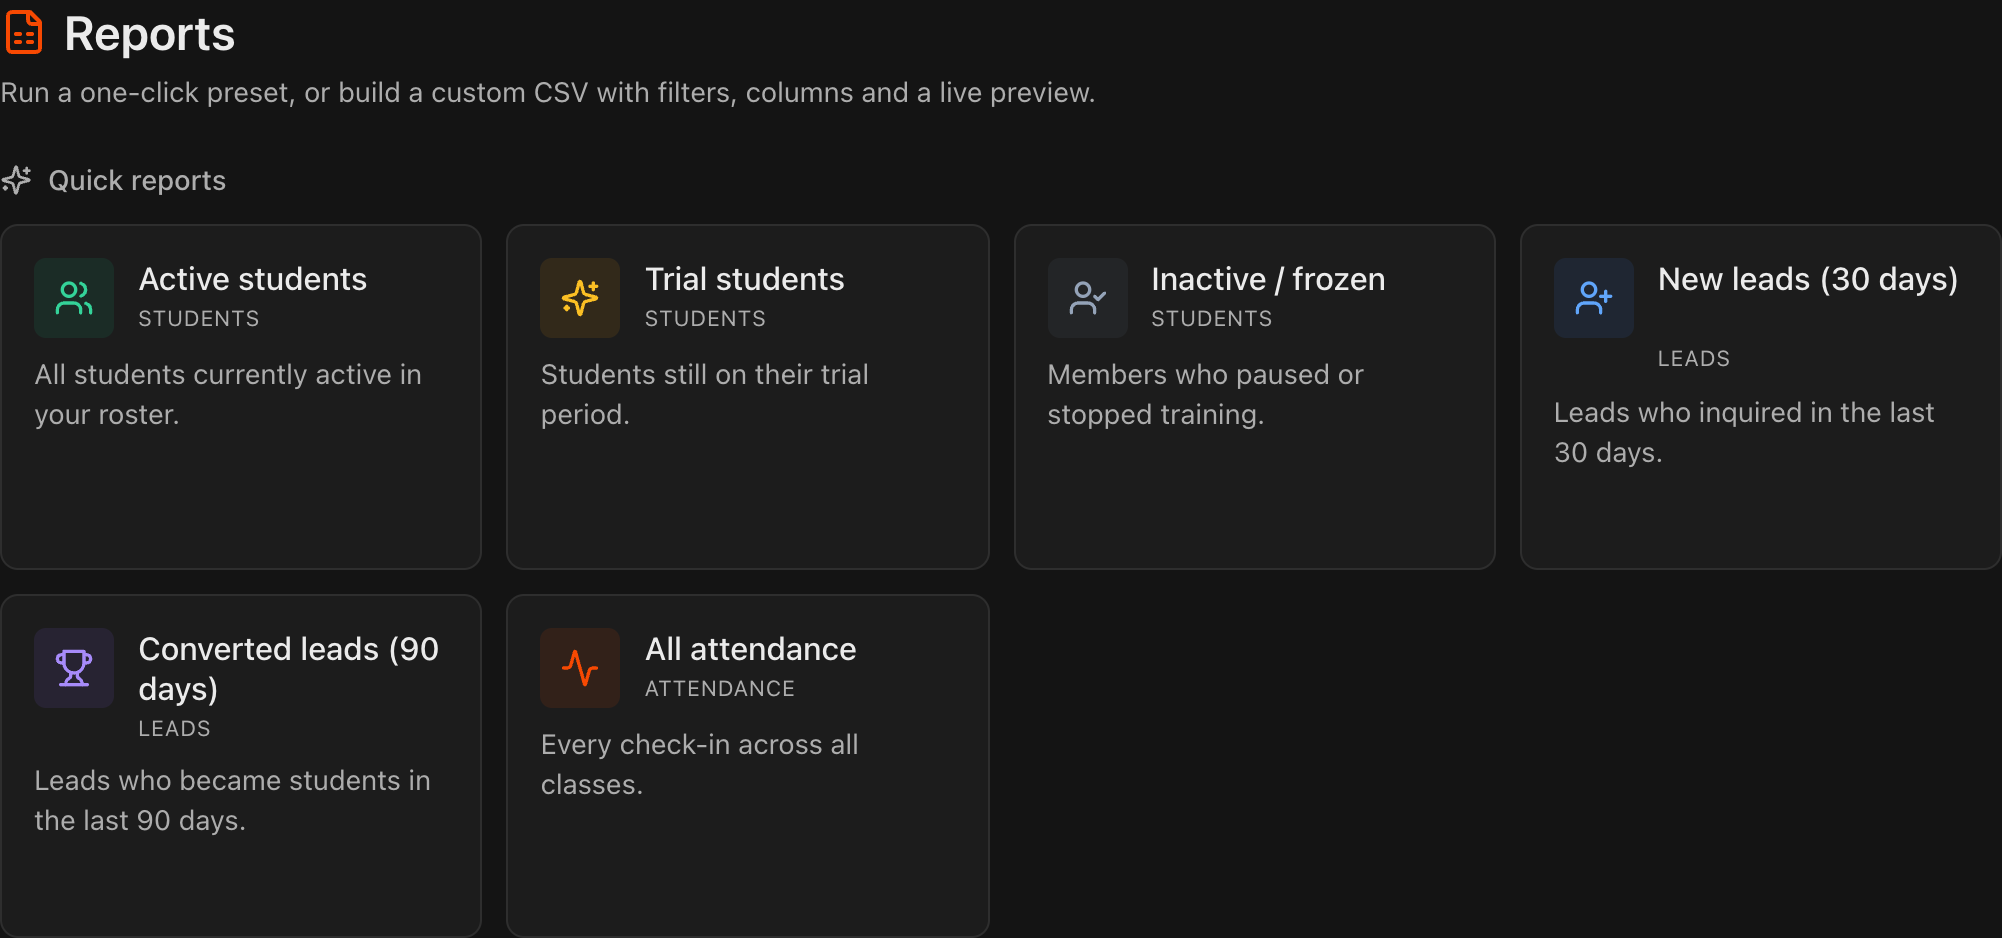
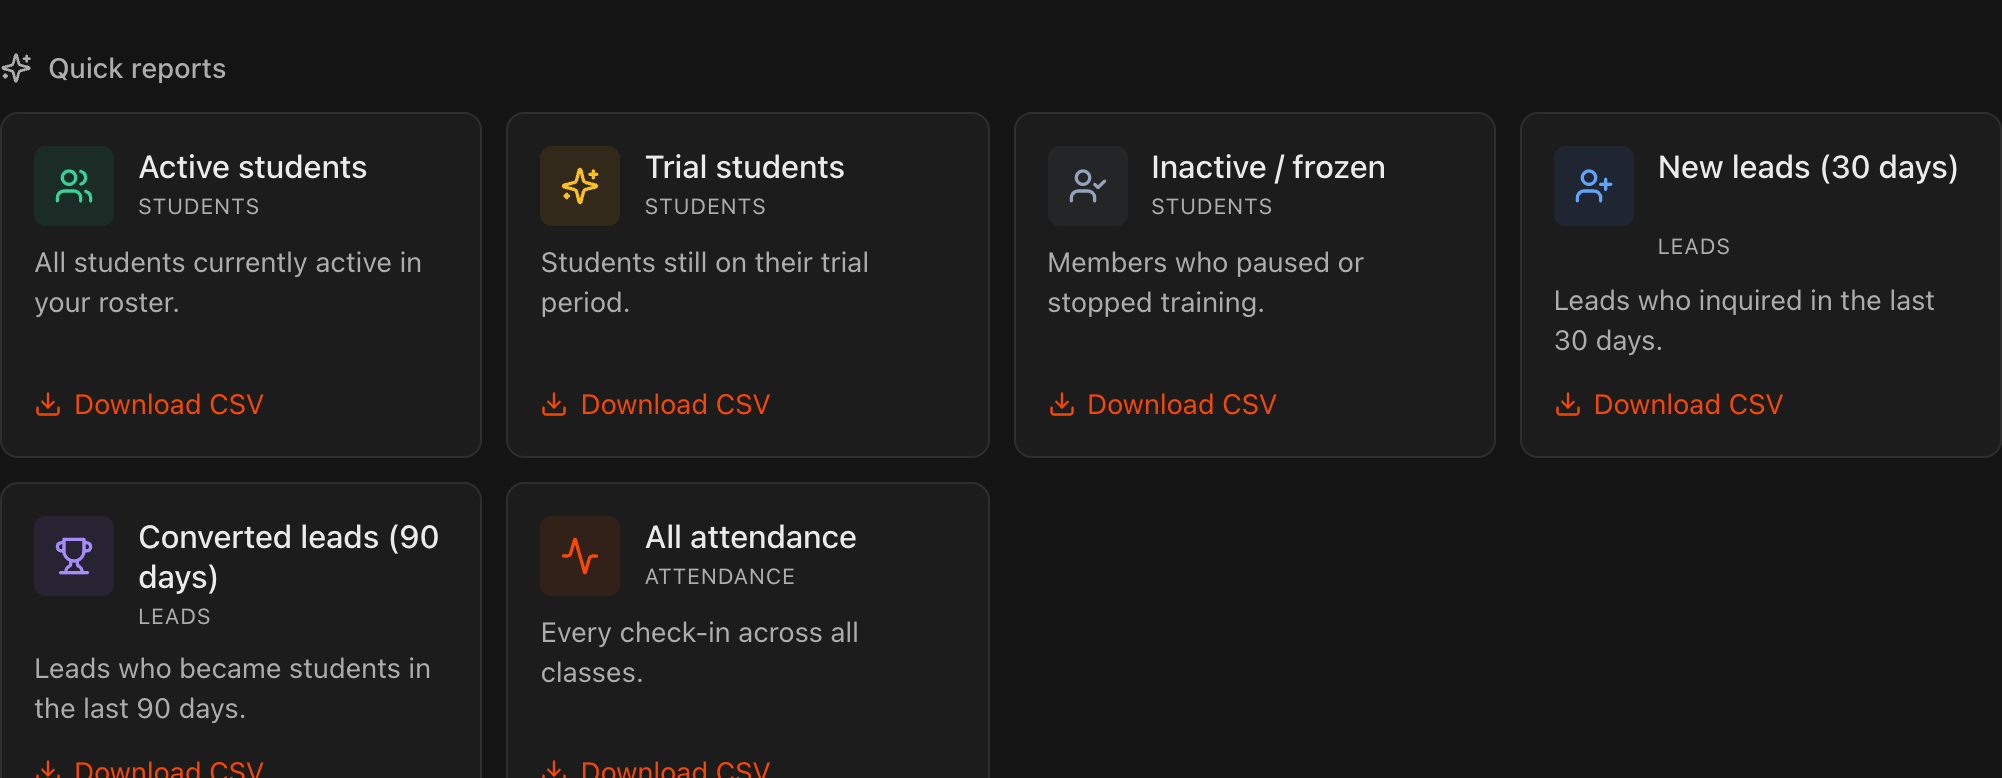
Quick reports are ready-made presets: Active students, Trial students, Inactive / frozen, New leads (30 days), Converted leads (90 days), and All attendance.
Hover over a card and click Download CSV.
The report saves straight to your device as a CSV file.
Note
Quick reports need no setup. Filters and columns are pre-configured, so this is the fastest way to pull a standard report.
Choose a dataset for a custom report
Scroll down to the Custom report section.
Pick the dataset you want to report on: Students, Leads, or Attendance.
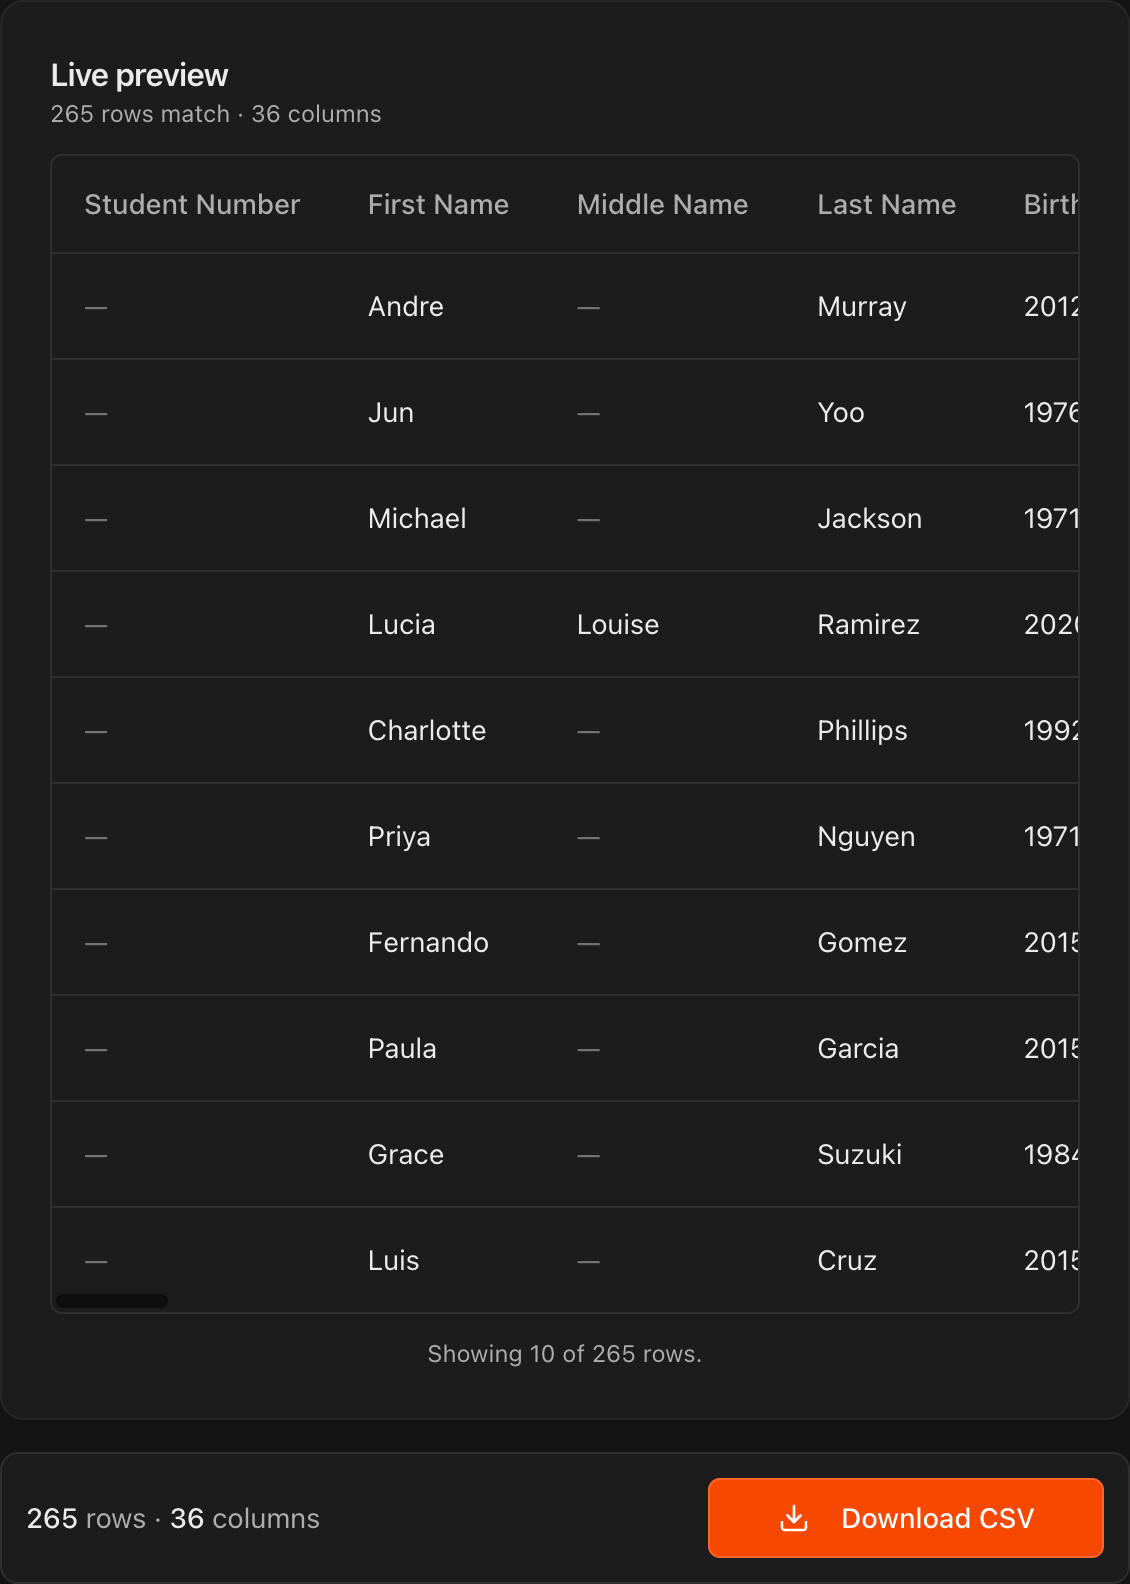
The Live preview on the right updates as you change any setting.

Refine your report with Filters
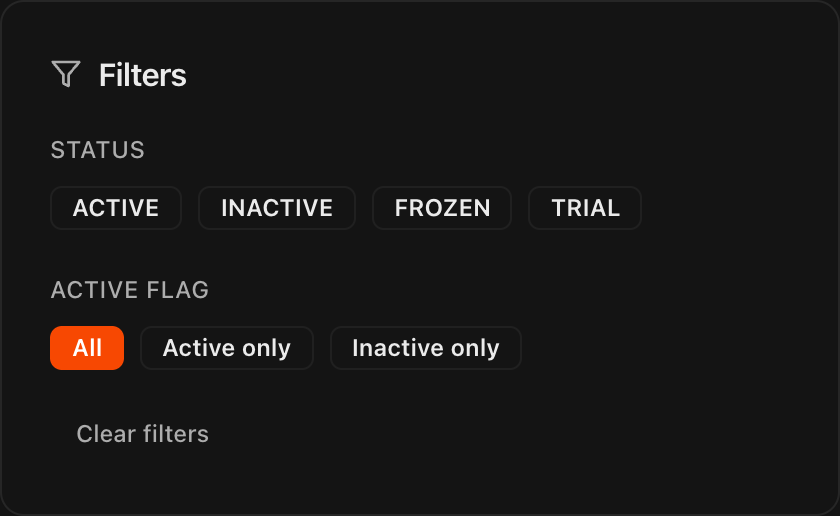
In the Filters card, click a chip to narrow which rows are included.
The Students dataset filters by Status (Active, Inactive, Frozen, Trial) and by Active flag.
The Leads dataset filters by Stage, an Include archived leads checkbox, and an Inquiry date range.
Click Clear filters at any time to start over.
Note
The **Attendance** dataset includes every check-in and has no filters. Use **Columns** to shape that report instead.
Choose which Columns to include
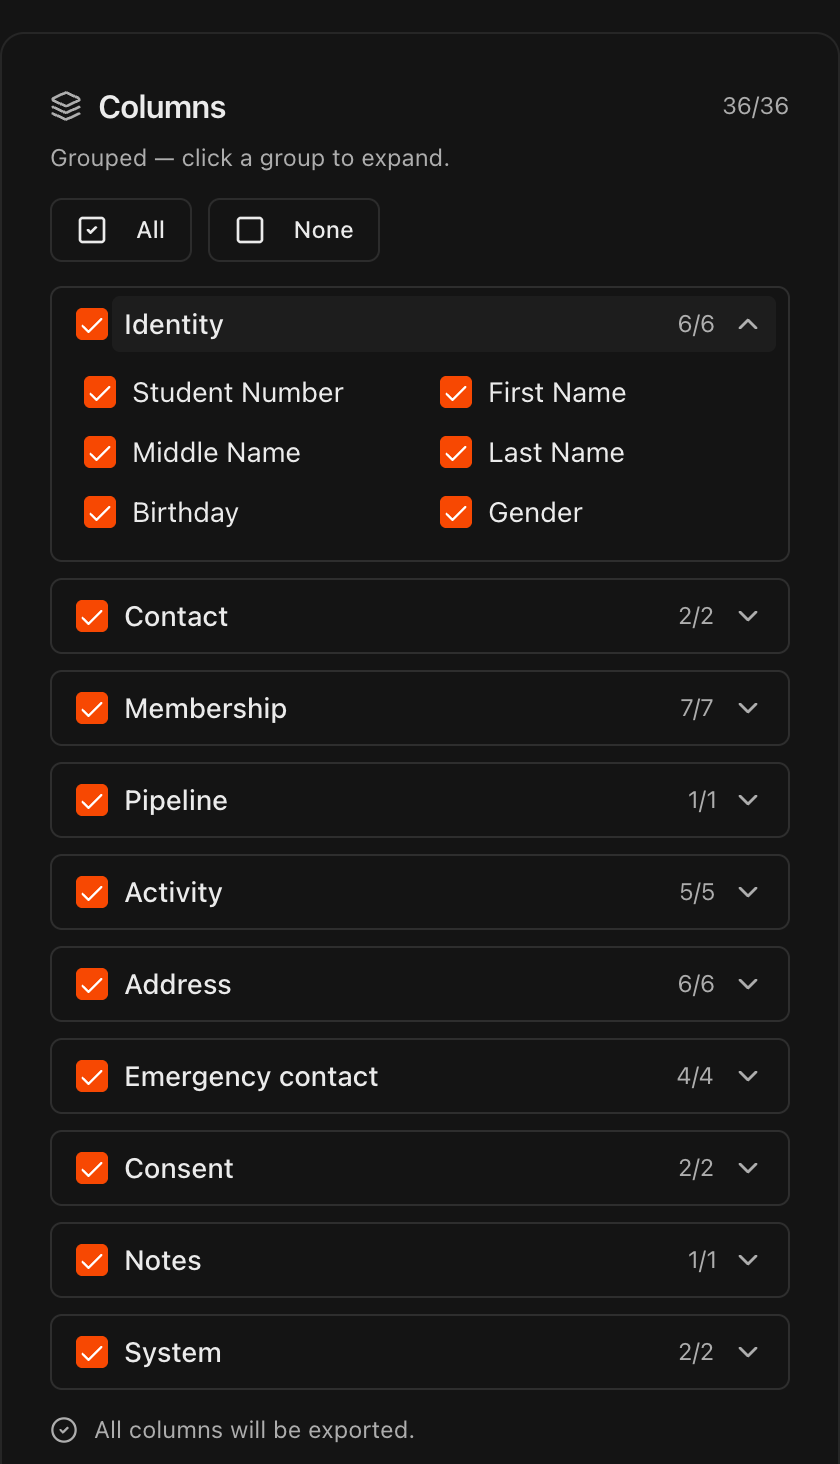
The Columns card groups related fields, like Identity, Contact, and Membership.
Click a group to expand it, then check or uncheck individual columns.
Use All or None to select or clear everything at once.
The counter at the top right of the card shows how many columns are selected.
Preview and download your custom report
The Live preview shows the first 10 rows plus a running row and column count.
When the preview looks right, click Download CSV at the bottom right.
The file saves to your device and opens in Excel, Google Sheets, or any spreadsheet app.
Tip
The row counter updates instantly as you change filters, so you can sanity-check the report before you download it.